

At Torii, we’re constantly using data in interesting ways to help our buyers make the most informed decisions that they can. We use our proprietary algorithms to source the best properties, whether you’re looking for the highest-value multifamily in the most undervalued area, or you want to find the hippest loft at the best price. Whatever your fancy, we’ll help you find it.
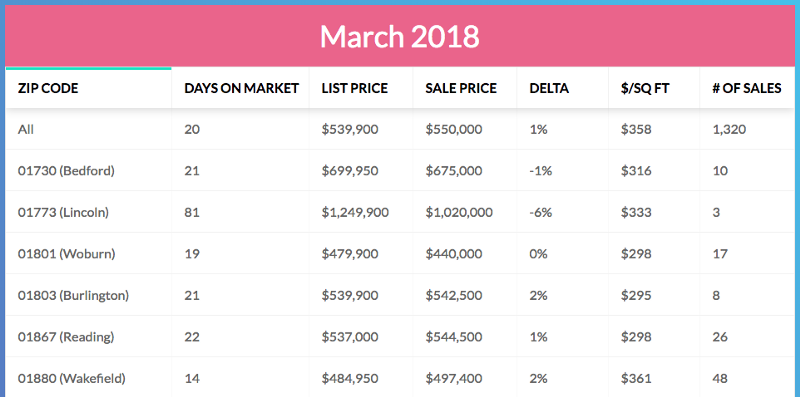
Here we’ve got a summary analysis of sales in March for all Greater Boston Area zip codes. There’s a lot of great information in here, so check it out. I’m just thankful I’m not buying in Newton Centre.
Read more below.
A few highlights:
Median market time ranged from 81 days in 01773 (Lincoln) at the high end, to 01908 (Nahant) at just 2 days.
The largest average amount over asking was in 02170 (Quincy), 02108 (Boston), and 02459 (Newton Centre) at 10%. That means that if you see a house listed in those zip codes at $700,000, you should expect to pay $770,000.
01773 (Lincoln) had the largest average discount from asking at 6%.
Most expensive? 02110 (Boston) at $1,379 per square foot.
Cheapest? 01905 (Lynn) at just $215 per square foot.
The median for the whole Boston area in March was $358 per square foot and a sale price of $550,000. The average market time was 20 days, and there was a 1% premium paid over asking.
To view our whole analysis for March 2018, click here. If you’re getting ready to buy, get in touch.